Dilbert says, “If it’s worth doing, it’s worth measuring.” Ok, so maybe Dilbert never really said that, but it’s one of the corporate adages about productivity that has stayed with me. In marketing and communications, this often translates into…
- Webinar sign-ups and attendance
- Whitepaper downloads
- Email open and click-thru rates
I’m passionate about metrics, so when I saw the graphic below on a video board in New York City, it stopped me in my tracks. It takes analytics in an entirely different direction and I’ll bet whoever thought of compiling and sharing this information wears happy socks.
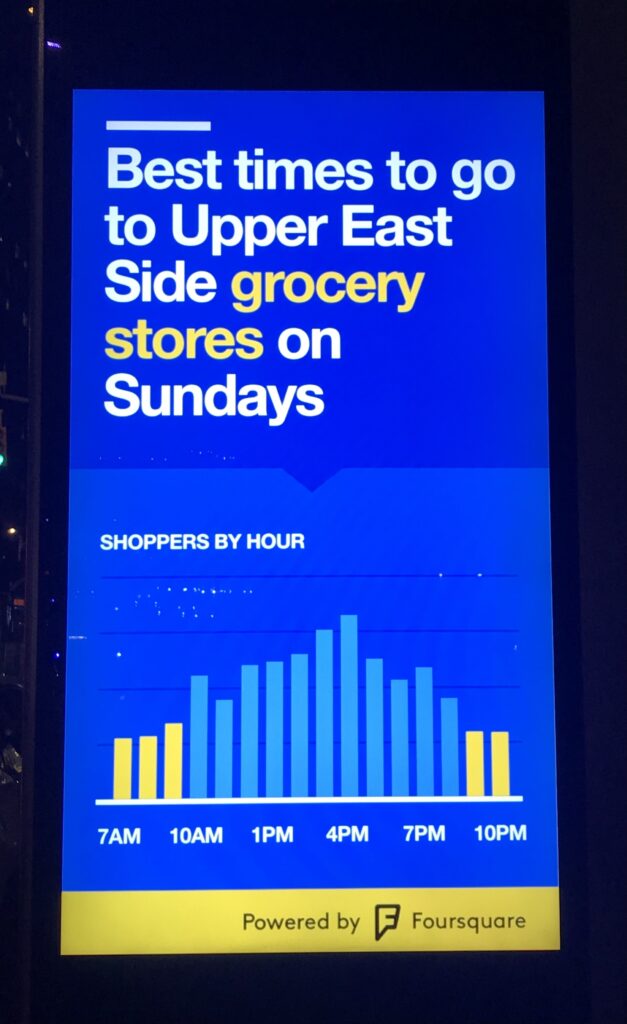
It’s not often that a billboard offers data to the masses, but in this case, this information addresses a legit consumer pain point — going to the grocery store when it’s not going to be crowded. If you’ve ever waited on a checkout line in a Trader Joe’s in Manhattan, you know exactly what I’m talking about (even pre-pandemic).
Color Outside the Lines
Imagine taking something like this and making it part of a campaign for a supermarket. Rather than seem self-serving, it would convey the message that this store wants to be helpful to its customers and provide more than food, but safety, efficiency, and peace of mind. It’s a case of thinking beyond the obvious and adding value. So how can you use this concept in your next campaign or message? What data can you pull together for your audience to solve their pain points?
I’ll meet you at the grocery store at 11 AM on Sunday and we can discuss. 🙂